Introduction
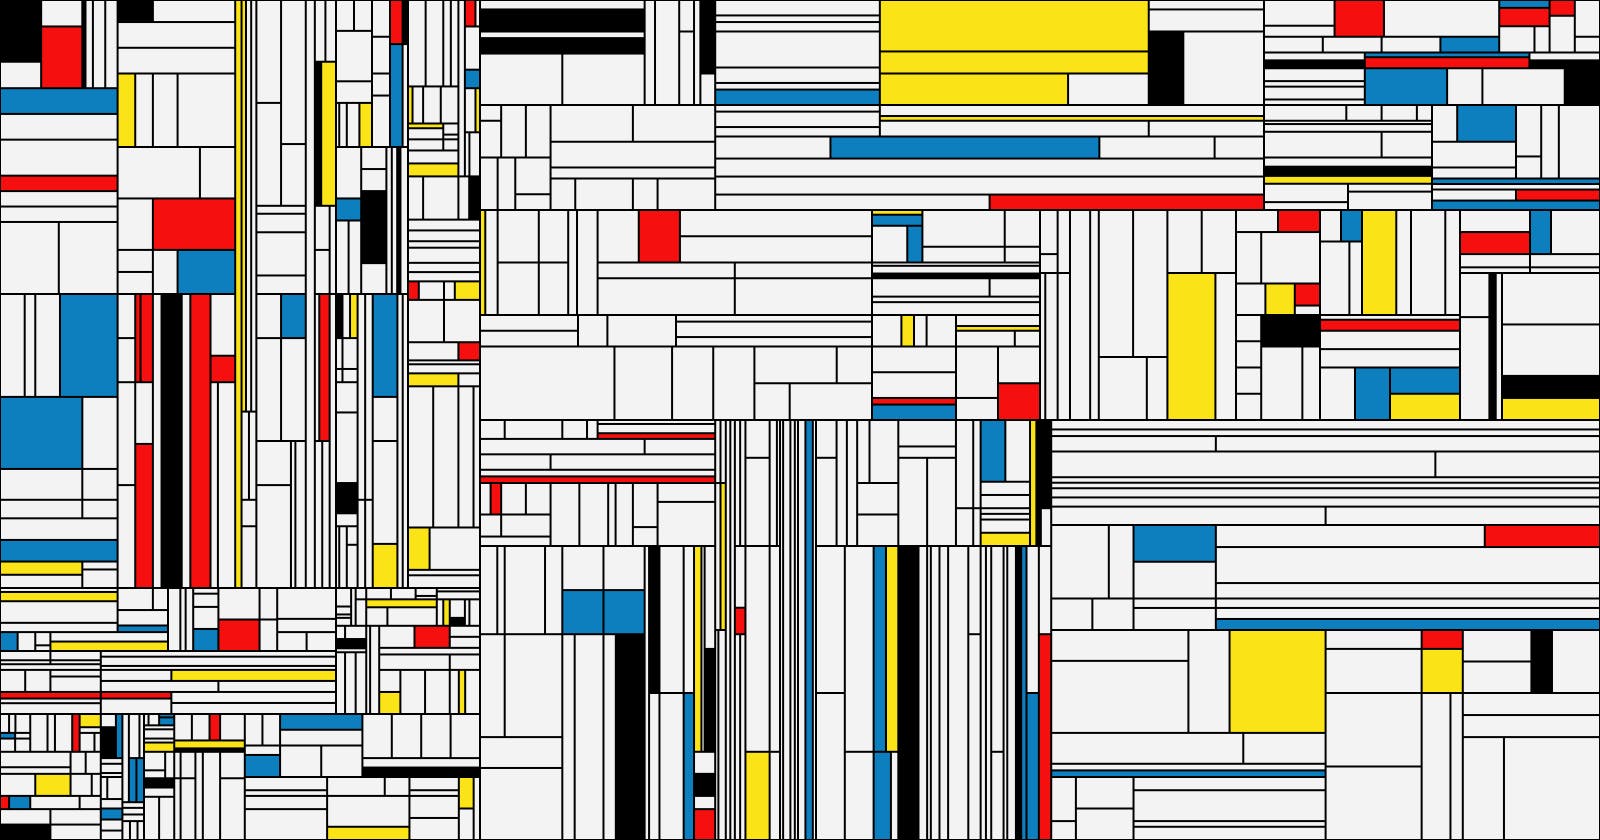
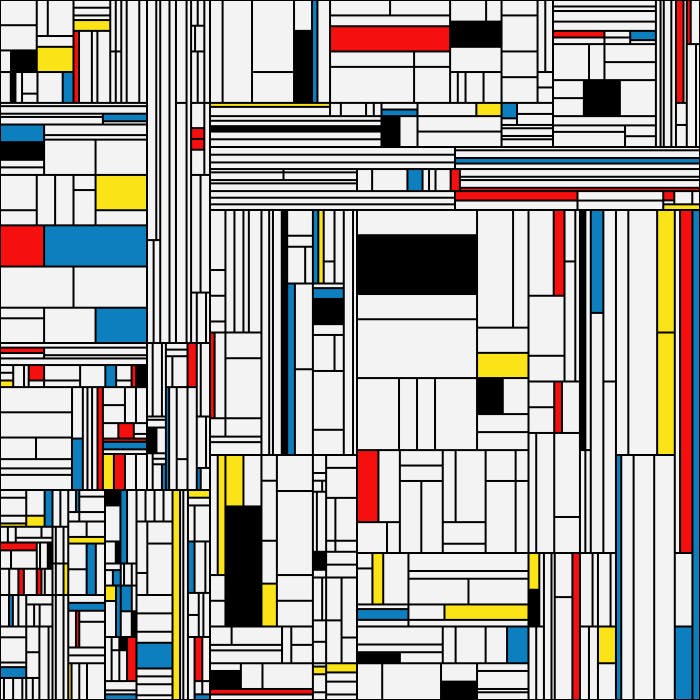
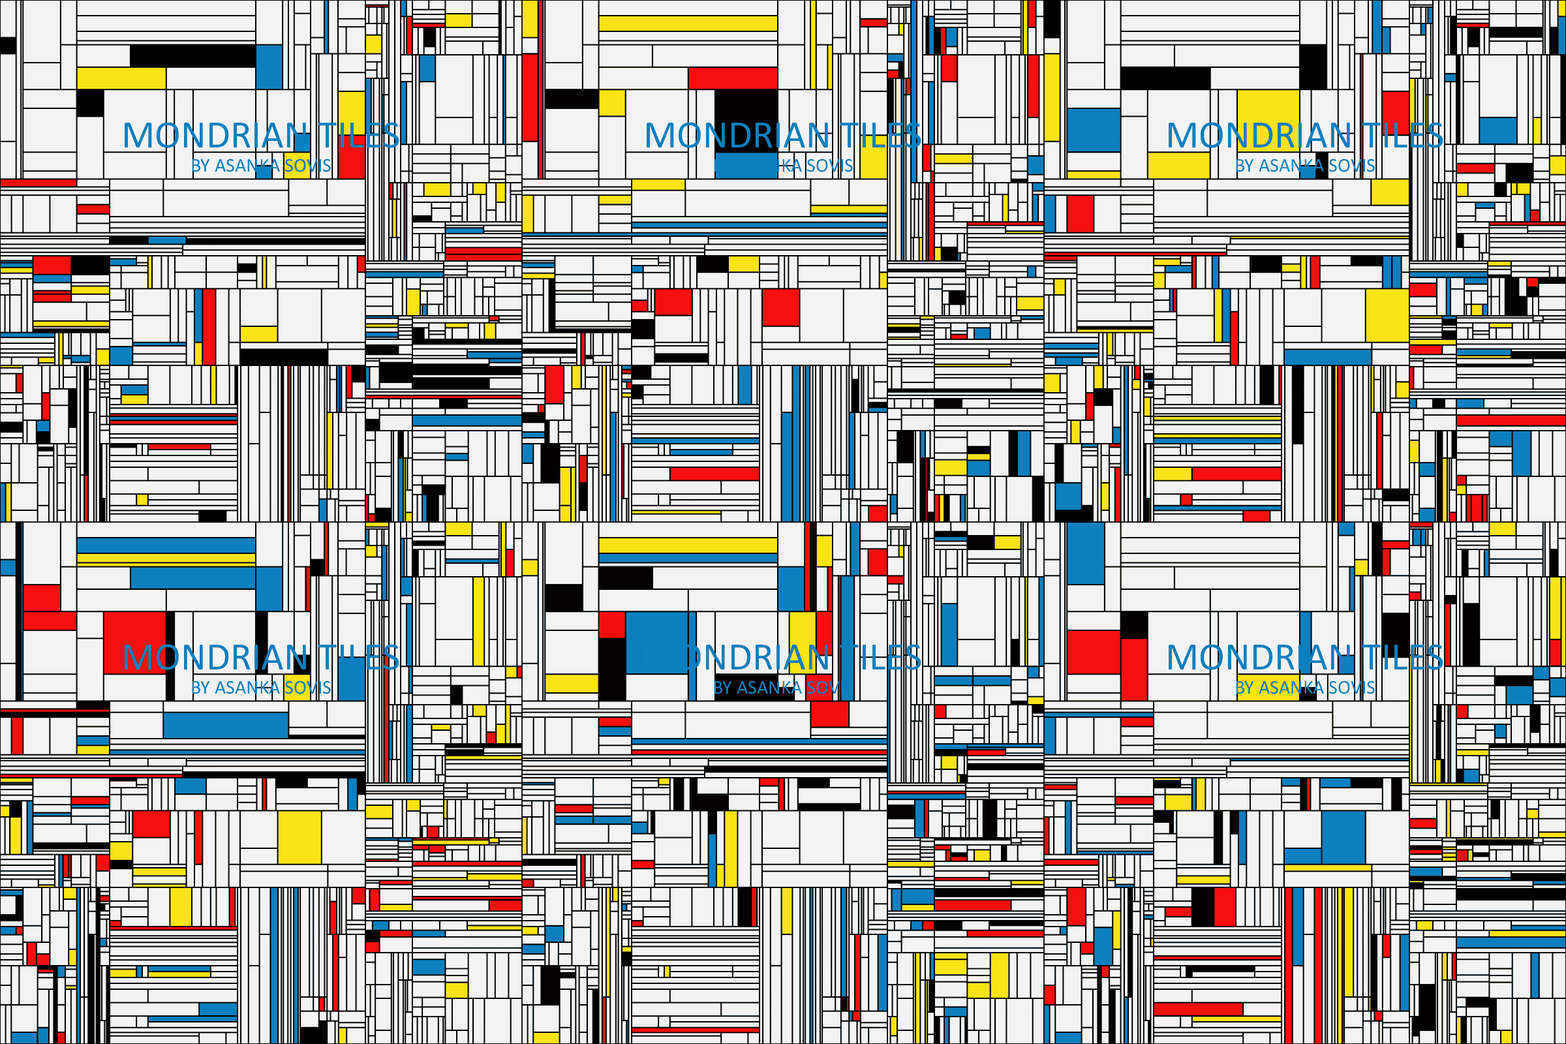
Piet Mondrian is a Dutch artist who is regarded as one of the greatest artists of the 20th century. Mondrian Tiles come from some of the paintings he did and consist of colourful tiles arranged in a pattern. In this article, we will try to recreate these patterns using an algorithm.

Background
As usual, we will handle this using Processing. However, instead of the default Java language, we will use the Python language in this example as the data structures in Python are helpful for this. To switch to Python, you can click on the drop-down menu on the top-right and select 'Add More...' Then select 'Python Mode for Processing 3' and click 'Install'. After this, you can use the same drop-down menu to select the Python Mode.
Implementation
Setting Up
As usual, we will create a canvas and set the background colour as zero. We will also remove the stroke and set the frame rate to 1 so that we can animate the pattern at a slow rate.
Constants and Variables
First of all, we will define a variable to hold the tiles. For this, we can use the list data type available in Python. We will then define a few constants we need.
# Splitting Constants
splits = [0.3, 0.5, 0.7]; # Few splitting ratios to split a tile
optimumDepth = 10; # Maximum depth we go within the recursive algorithm

# Drawing Constants
spacing = 1; # Spacing between tiles
minSize = 10 # Minimum size of a tile

# Colour palette
palette = ['#f3f3f3', '#f50f0f', '#fae316', '#0d7fbe', '#000000'] #
paletteProb = [0.8, 0.05, 0.05, 0.05, 0.05] # Probabilities defined for each colour in the palette
The Code
Splitting Function
The way we achieve the tiling effect is by using a programming technique called 'Recursion'. Recursion means that we call the function from within itself. From this, we can achieve interesting mathematical outcomes.
In our case, we first start with a tile, which is the canvas itself. We then split this tile into two. We then split these tiles further, the resulting ones and so on. Thus, we end up with a recursive algorithm. If we reach the maximum depth allowed, or the resulting tile is smaller than the defined size, we simply return the location and size as a tuple data type defined in Python language.
def split(myX, myY, myWidth, myHeight, depth):
    if ((depth == optimumDepth) or (myWidth < minSize) or (myHeight < minSize)):
        return (myX, myY, myWidth, myHeight)

    else:
        tile1 = 0
        tile2 = 0

        if (random(0, 1) > 0.5):
            splitSize = myWidth * splits[int(random(0, len(splits)))]
            tile1 = (myX, myY, splitSize, myHeight)
            tile2 = (myX + splitSize, myY,  myWidth - splitSize, myHeight)

        else:
            splitSize = myHeight * splits[int(random(0, len(splits)))]
            tile1 = (myX, myY, myWidth, splitSize)
            tile2 = (myX, myY + splitSize,  myWidth, myHeight - splitSize)

        return [split(tile1[0], tile1[1], tile1[2], tile1[3], depth + 1), split(tile2[0], tile2[1], tile2[2], tile2[3], depth + 1)]
The splitting works as follows: First, we decide if splitting is done horizontally or vertically by generating a random number. Then we pick a random splitting ratio and generate the split size. Then we create one tile with the split size and another for the remaining size.
Drawing
Once we complete the tiling process, we draw the tiles on the screen. This is done by iterating over all the items in the tiles list and for each item if the item is a tuple we draw it. Otherwise, we call the same function to draw the sublist. (Recursion again)
def drawTiles(tileList):
    noStroke();

    for item in tileList:
        if (type(item) is list):
            drawTiles(item)

        else:
            if ((item[2] > (spacing * 2)) and (item[3] > (spacing * 2))):
                drawTile(item[0], item[1], item[2], item[3]);
When we draw the tiles, we skip the tiles that are too small. Each tile will be coloured with a random colour from the palette. Each colour is selected from a cumulative distribution function.
Cumulative Distribution Function
A Cumulative Distribution Function is a function that allows us to use a set of probabilities to choose a set of random items according to the probability of each item. Implementing this is simple.
def randomDist():
    pdf = [(0, paletteProb[0]), (1, paletteProb[1]), (2, paletteProb[2]), (3, paletteProb[3]), (4, paletteProb[4])]
    cdf = [(i, sum(p for j,p in pdf if j < i)) for i,_ in pdf]

    return max(i for r in [random(0, 1)] for i,c in cdf if c <= r)

Finalising
Once all of this is done, we will call the drawTiles function from the draw function to animate our pattern. With this, we have a version of the Mondrian Tiles generated through code. We can change the colour palette, spacings and split ratios to create interesting patterns. As usual, you can find the code in the Github Repository.

External Links:
- Github Repository with the Processing Code: Github Repository
- Wikipedia article on Piet Mondrian: wikipedia.org
- Website dedicated for the works of Piet Mondrian: piet-mondrian.org
- Wikipedia article on Recursion: wikipedia.org
- Wikipedia article on Cumulative Distribution Function: wikipedia.org
